
Stay Connected
Get the latest updates for partners and stakeholders from the U.S. Census Bureau.
Social Media Toolkit: The First 2020 Census Results
The 2020 Census determines congressional representation, informs the allocation of hundreds of billions of dollars in federal funding, and provides data that affects communities for the next 10 years.
You helped us spread the word about the 2020 Census count. Now the first results are in!
Social media is a great way to help us share the news.
Remember to:
- Tag @uscensusbureau in your posts. We are on Twitter, Facebook, Instagram, and LinkedIn
- Use the hashtag: #2020Census
- Link to Census.gov so your followers can learn more about the first results of the 2020 Census
This social media toolkit includes:
- Downloadable graphics, animations, and videos that you can use on your own social media channels
- Sample social media posts for Twitter, Facebook, Instagram, and LinkedIn
- Links to 2020 Census resources for partners and stakeholders
- Links to resources in languages other than English
How To Use This Toolkit
- Choose the type of asset you will use (graphic, animation, or video) and the social media channel you plan to post on.
- Click “DOWNLOAD ASSET” to save the graphic, animation, or video to your device.
- Highlight and select the text that you want to use for your social media post and copy the text to your clipboard.
- Go to the social media channel you plan to post on, paste the copied text, and add the downloaded graphic or animation to your post.
The First Results of the 2020 Census
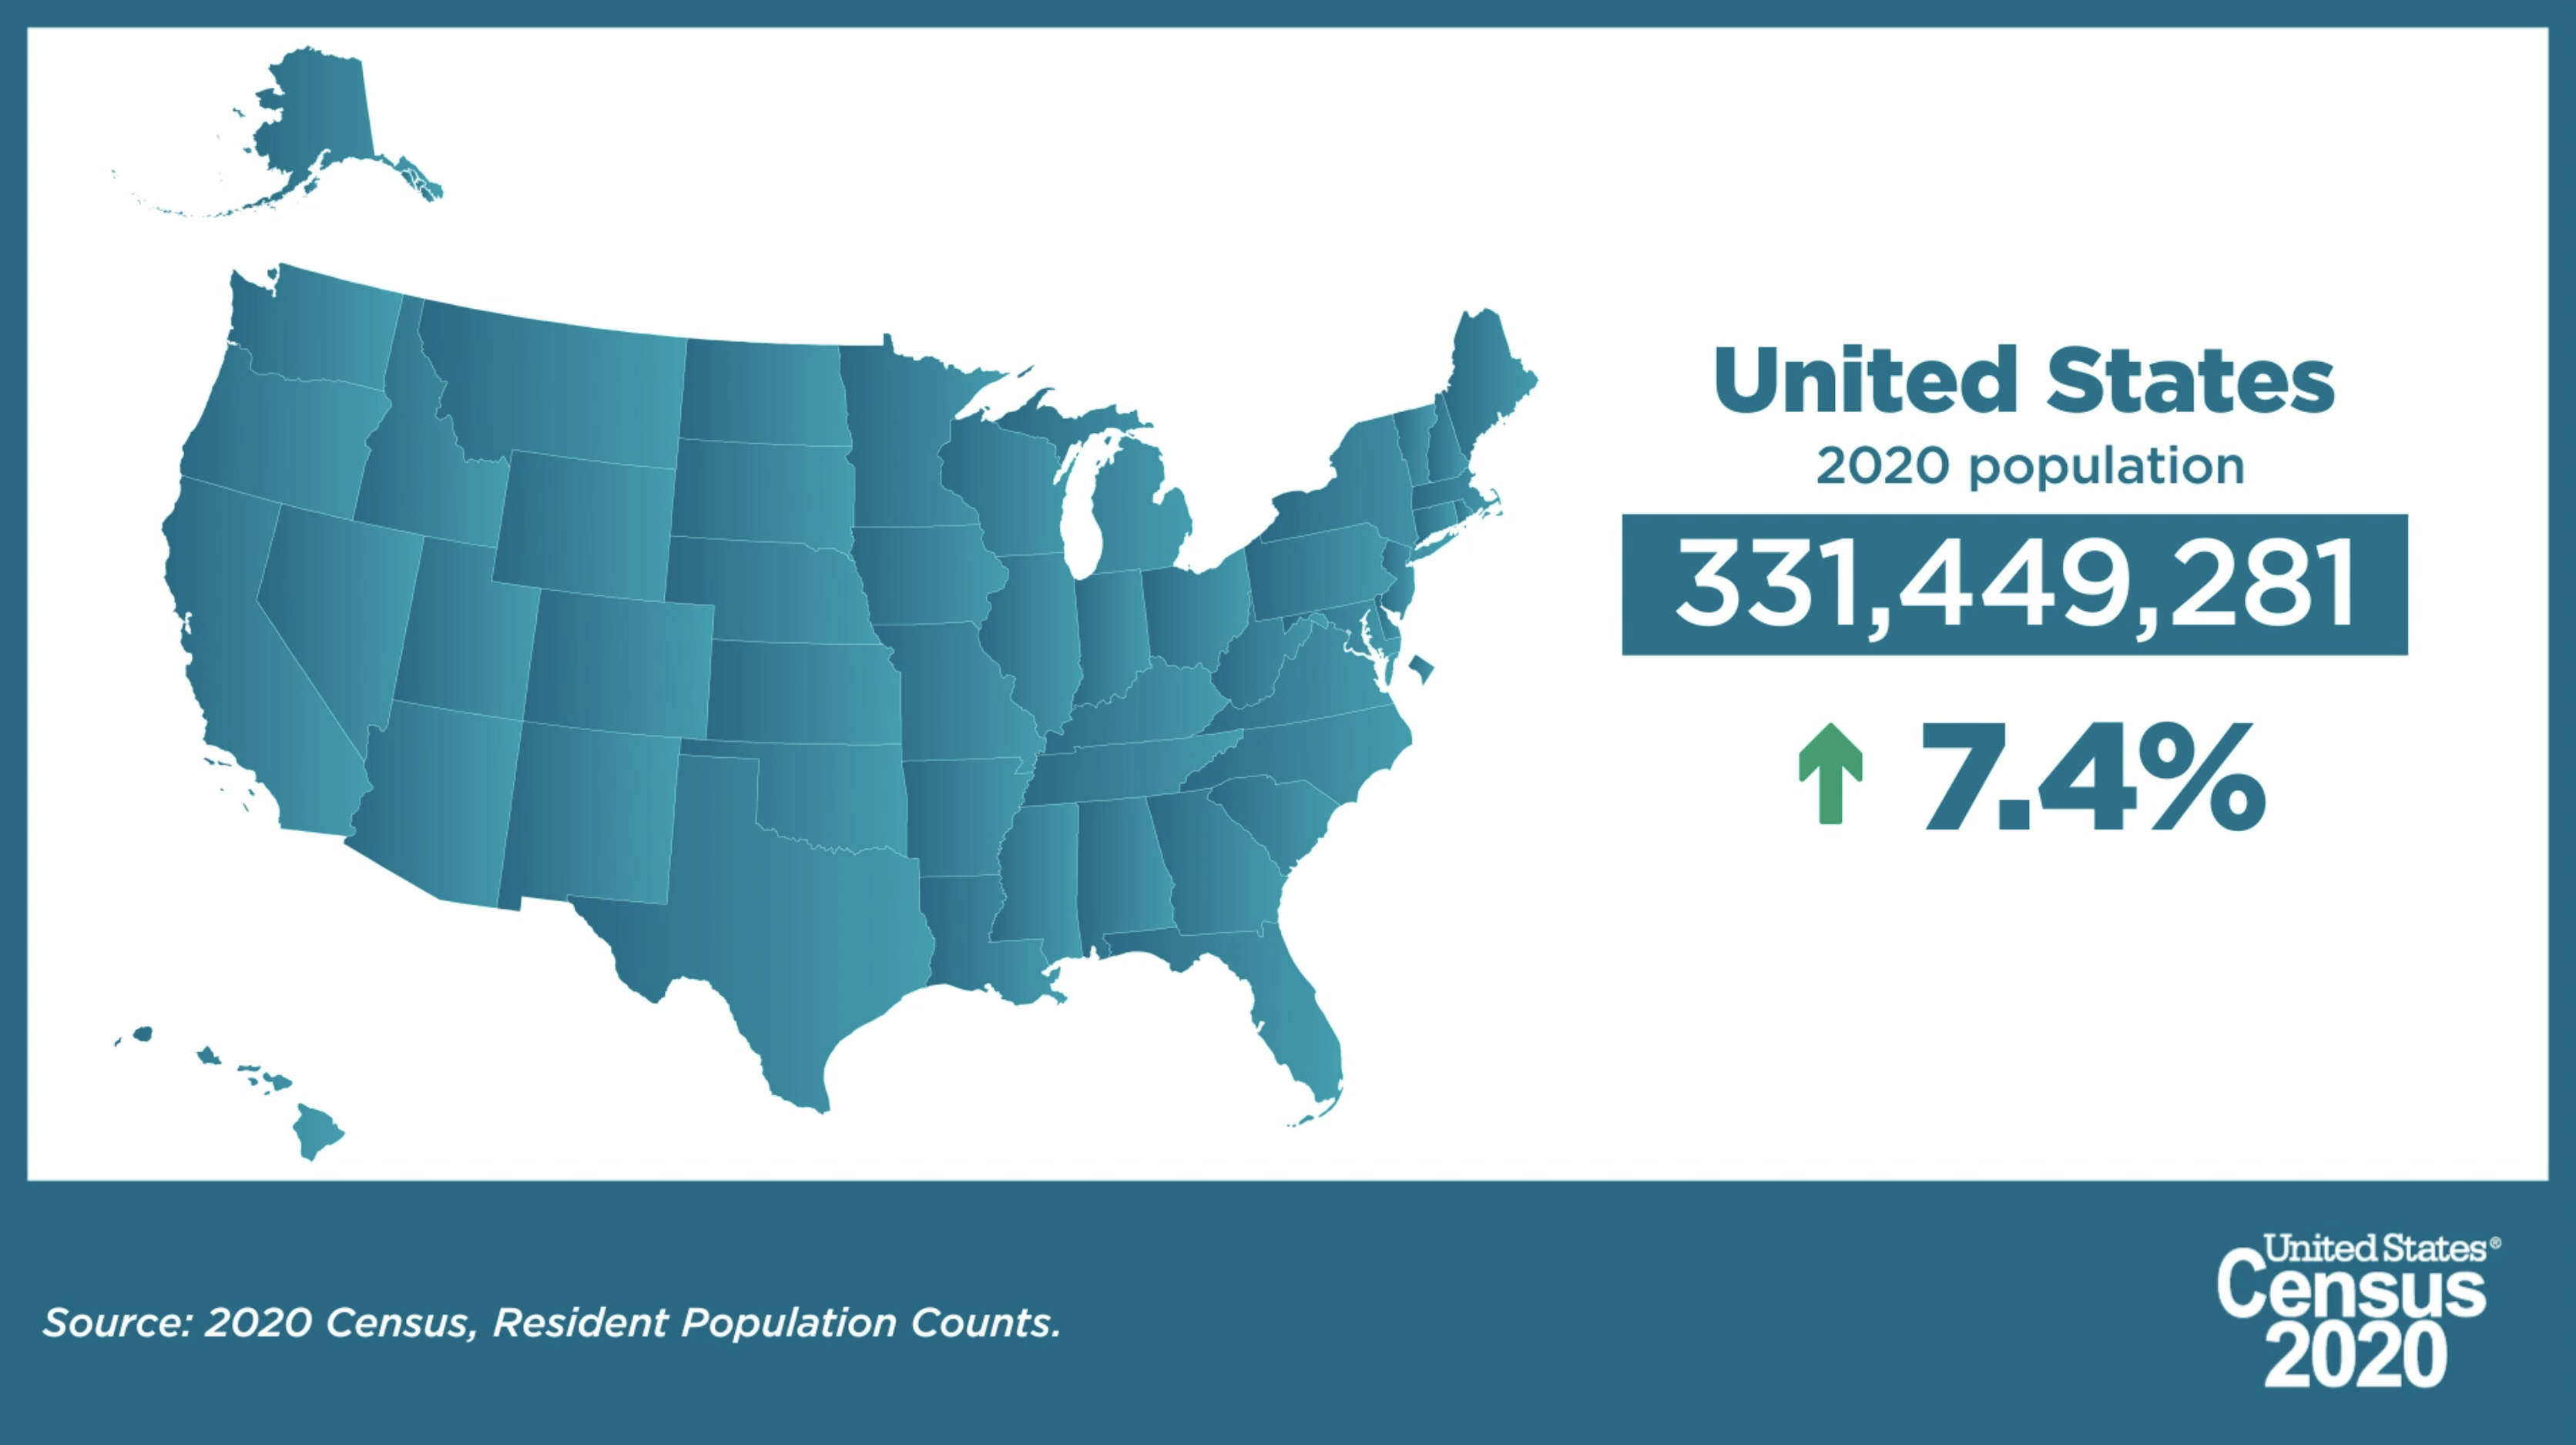
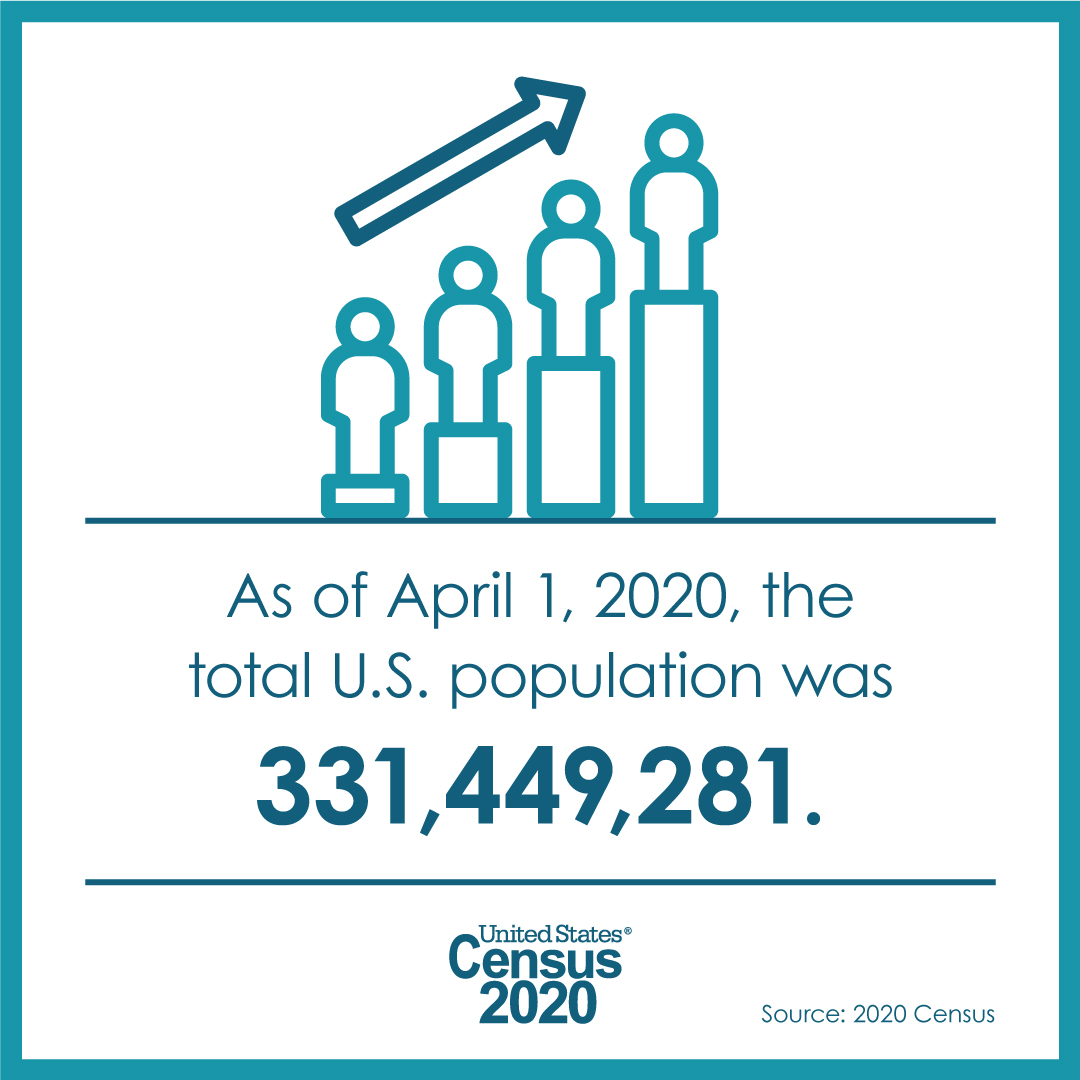
The 2020 Census took a snapshot of all people living in the United States on April 1, 2020 and the results are in. According to the 2020 Census, the number of people living in the United States was 331,449,281. We encourage you to share the items in this toolkit and add your personal touch to these messages to align with the interests of your audience.
Animation
Any Platform
POST MESSAGE:The number of people living in the United States, including the 50 states and the District of Columbia, was 331,449,281 as of April 1, 2020, an increase of 7.4% since the 2010 Census. #2020Census
Graphics
Facebook / Twitter / LinkedIn
The Census Bureau released the first #2020Census results, which included the number of seats each state will have in the U.S. House of Representatives. Here are the results: https://go.usa.gov/xHfDb #Apportionment #CensusBureau
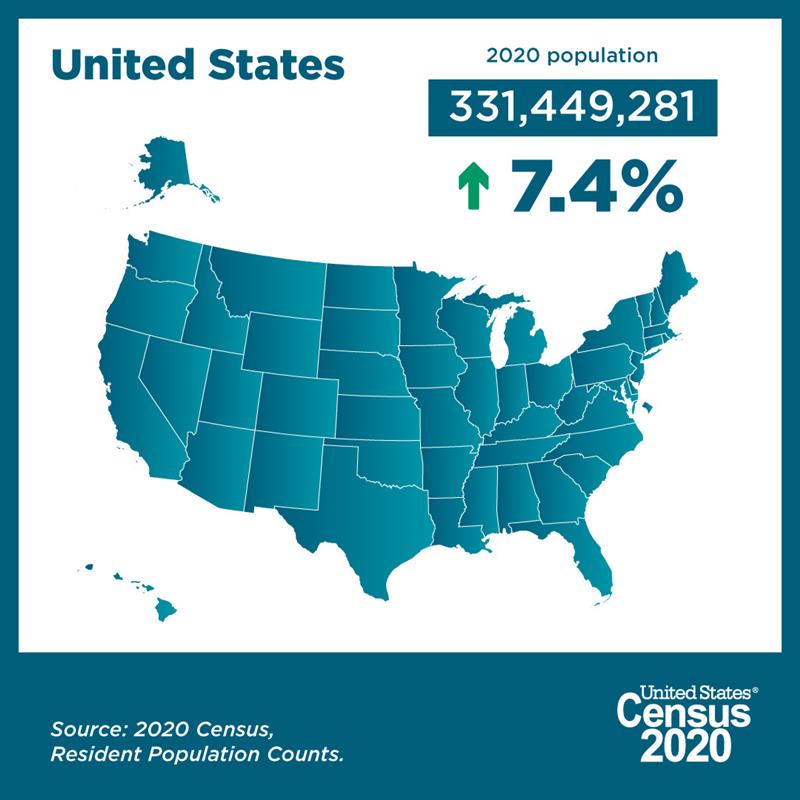
2020 Census Population by State or Territory
Share these animations and graphics for each of the 50 states, the District of Columbia, and Puerto Rico.
The number of people living in Alabama was 5,024,279 as of April 1, 2020, an increase of 5.1% since the 2010 Census. #2020Census View Alabama’s population change by decade 👉 https://go.usa.gov/xHfDb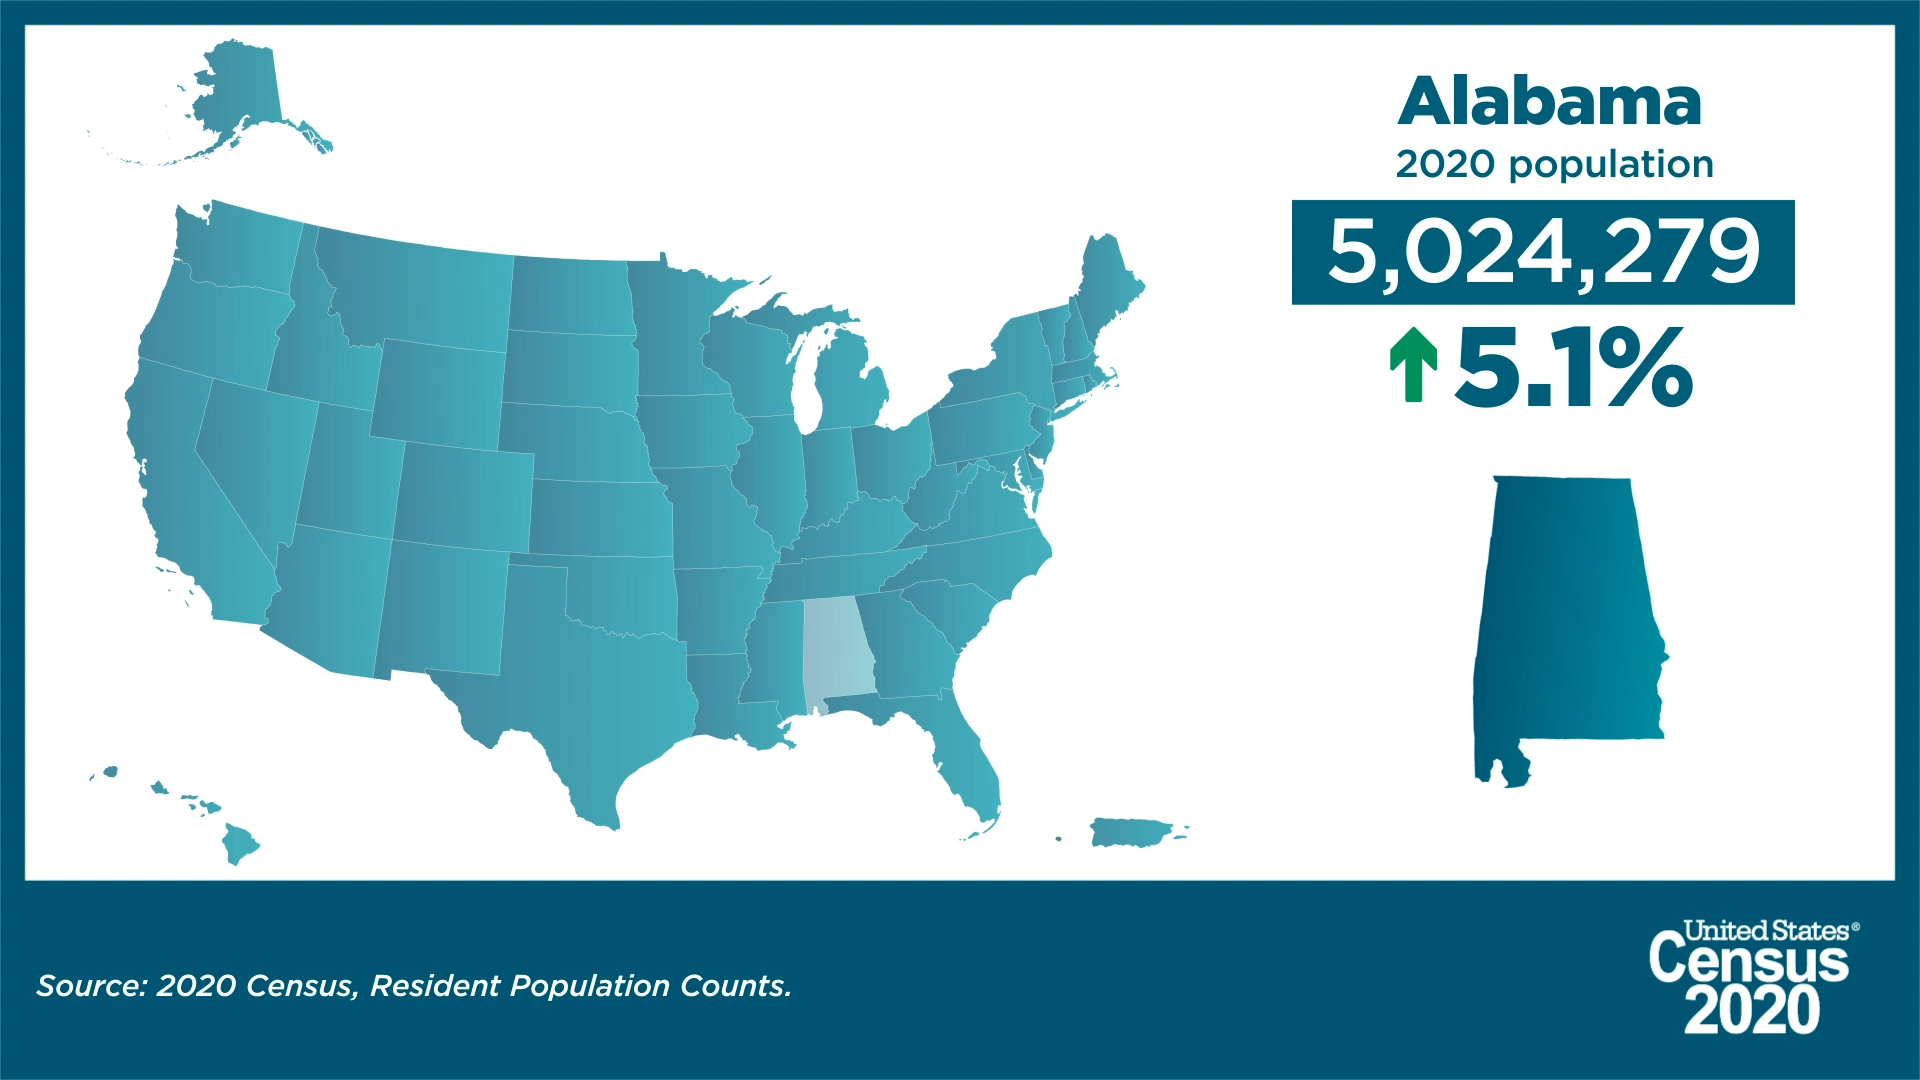
2020 Census Apportionment Population Counts
Apportionment is the process of distributing the 435 memberships, or seats, in the U.S. House of Representatives among the 50 states based on the apportionment population counts from the 2020 Census. The “Historical Apportionment Data Map” displays apportionment results for each census from 1910 to 2020.
Animation
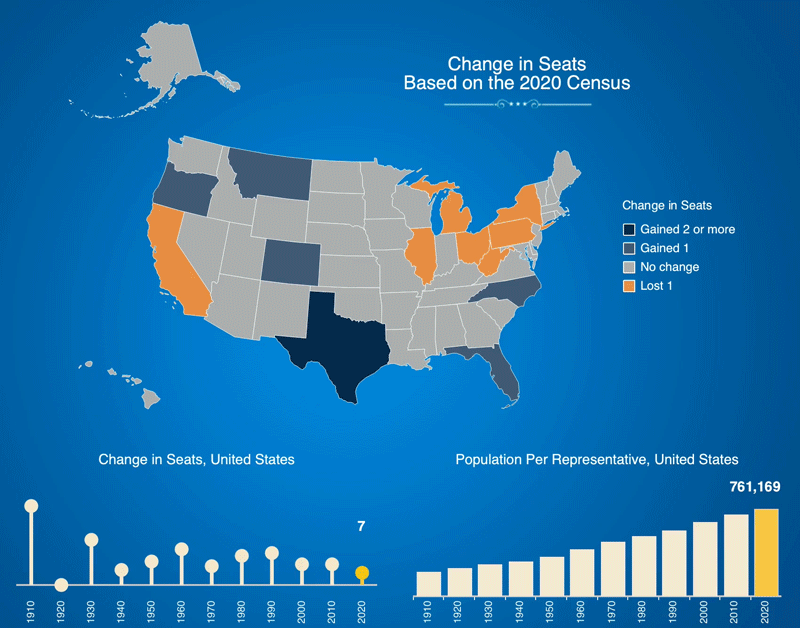
View more than 10 decades of #apportionment and population data by exploring this interactive Historical Apportionment Data Map 👉 https://go.usa.gov/xHnkH #2020Census #CensusBureau
Graphic
View more than 10 decades of #apportionment and population data by exploring this interactive Historical Apportionment Data Map 👉 https://go.usa.gov/xHnkH #2020Census #CensusBureau
More 2020 Census Resources for Social Media
Use the menu below to select a video or graphic:
Apportionment is the process of calculating how many seats each state gets in the U.S. House of Representatives. To learn more about how apportionment works, check out this video and visit https://go.usa.gov/xHRwR
On 4/26, the U.S. Census Bureau released the #2020Census state population counts, which are used to determine each state’s number of seats in the U.S. House of Representatives. #Apportionment #CensusBureau
After every decennial census, the U.S. Census Bureau releases detailed metrics on data quality. Learn more about the quality of the 2020 Census at https://go.usa.gov/xHnRh
25-second Video
40-second Video
2.5-minute Video
After every decennial census, the U.S. Census Bureau releases detailed metrics on data quality. Learn more about the quality of the 2020 Census at https://go.usa.gov/xHnRh
Helpful Links for Partners and Stakeholders
We encourage you to tag the U.S. Census Bureau and/or include a link to our posts whenever possible.
Thank you for sharing the first 2020 Census results with your audience.
U.S. Census Bureau Official Social Media
Hashtag – #2020Census
2020 Census Apportionment Resources
2020 Census Apportionment Results
2020 Census Apportionment Counts Press Release
2020 Census Apportionment Counts Press Kit
Historical Apportionment Data Map
More 2020 Census Resources
America Counts: First 2020 Census Data Release Shows U.S. Resident Population of 331,449,281
Map: Apportionment of the U.S. House of Representatives
Map: 2020 Resident Population for the 50 States, the District of Columbia, and Puerto Rico
Data Quality Resources
Video: Data Quality and the 2020 Census
2020 Census Quality and Data Processing Press Release
2020 Census Quality and Data Processing Press Kit
2020 Census: Operational Quality Metrics
A Preliminary Analysis of U.S. and State-Level Results From the 2020 Census
Resources in Languages Other Than English
Video: What is Apportionment?
- Spanish
- Arabic
- Chinese (Simplified)
- Chinese (Traditional)
- French
- Haitian/Creole
- Japanese
- Korean
- Polish
- Portuguese
- Russian
- Tagalog
- Vietnamese
Oficina del Censo publica indicadores de calidad del Censo del 2020
Video: Data Quality and the 2020 Census