
Social Media Toolkit: Redistricting Data
The 2020 Census determines congressional representation, informs the allocation of hundreds of billions of dollars in federal funding, and provides data that affects communities for the next 10 years.
Redistricting data play an important role in our democracy and begin to illuminate changes to the local and demographic makeup of our nation over the last decade.
Help us spread the word about the latest 2020 Census results!
How To Use This Toolkit
- Choose the type of asset you will use (graphic, animation, or video) and the social media channel you plan to post on.
- Click the download button to save the graphic, animation, or video to your device.
- Highlight and select the text you want to use for your social media post and copy the text to your clipboard.
- Go to the social media channel you plan to post on, paste the copied text, and add the downloaded graphic or animation to your post.
- If posting on Instagram, make sure to add the relevant link to your bio so your followers can learn more.
- Remember to tag @uscensusbureau in your posts, use the hashtag #2020Census, and link to Census.gov.
Sample Social Media Posts
2020 Center of Population
Every 10 years, the Census Bureau has calculated the “center of population,” which is a point at where an imaginary, flat, weightless and rigid map of the United States would balance perfectly if everyone were of identical weight. This point represents the average location of where people in the United States live. Based on 2020 Census redistricting data, the center of population is located in Hartville, a tiny town in central southern Missouri. The Census Bureau also calculates centers of population for each state, county, census tract and census block group. Help us spread the word!
Facebook / Twitter / LinkedIn
The U.S. Census Bureau recently announced the new #CenterOfPopulation based on the #2020Census. The U.S. center of population is near the town of Hartville, Missouri. Find your state’s center of population with the Census Bureau’s new data visualization.
The U.S. Census Bureau recently announced the new #CenterOfPopulation based on the #2020Census. Hartville, a tiny town in central southern Missouri, is the new U.S. center of population. Find the location of your state’s center of population with the Census Bureau’s new #DataViz. Link in bio. #CenterOfPop #DataVisualization
2020 Census State Profiles
Dive into data-rich profiles for all 50 states, the District of Columbia and Puerto Rico on America Counts highlighting the recent 2020 Census redistricting data release. These sharable profiles provide key demographic characteristics for each state and county all on one page.
Facebook / Twitter / LinkedIn
The Census Bureau has released 52 individual data profiles for all 50 states, D.C. & Puerto Rico highlighting #2020Census redistricting data. Learn more about your state! 👉 State Profiles: 2020 Census
Redistricting Data Results
The Census Bureau provides states with the population counts they may use in the redrawing of their congressional and state legislative district boundaries. On August 12, the Census Bureau released this 2020 Census data on its public FTP site in the same format provided in recent decades.
Facebook / Twitter / LinkedIn
The Census Bureau has released #2020Census redistricting data. View the results 👉 Local Population Changes and Nation’s Racial and Ethnic Diversity
America Counts Redistricting Stories
Share the Census Bureau’s America Counts: 2020 Census Stories with your followers so they can read more about what we’ve learned from the 2020 Census redistricting data.
Facebook / Twitter / LinkedIn
Read the stories behind the numbers on the U.S. Census Bureau’s America Counts page for more insight on the #2020Census results.
Read the stories behind the numbers on the U.S. Census Bureau’s America Counts page for more insight on the #2020Census results. Click the link in bio for more.
Data Visualizations
2020 Census Demographic Data Map
To share a link to this visualization, click the share icon at the bottom right and copy the text under “Link” to your clipboard.
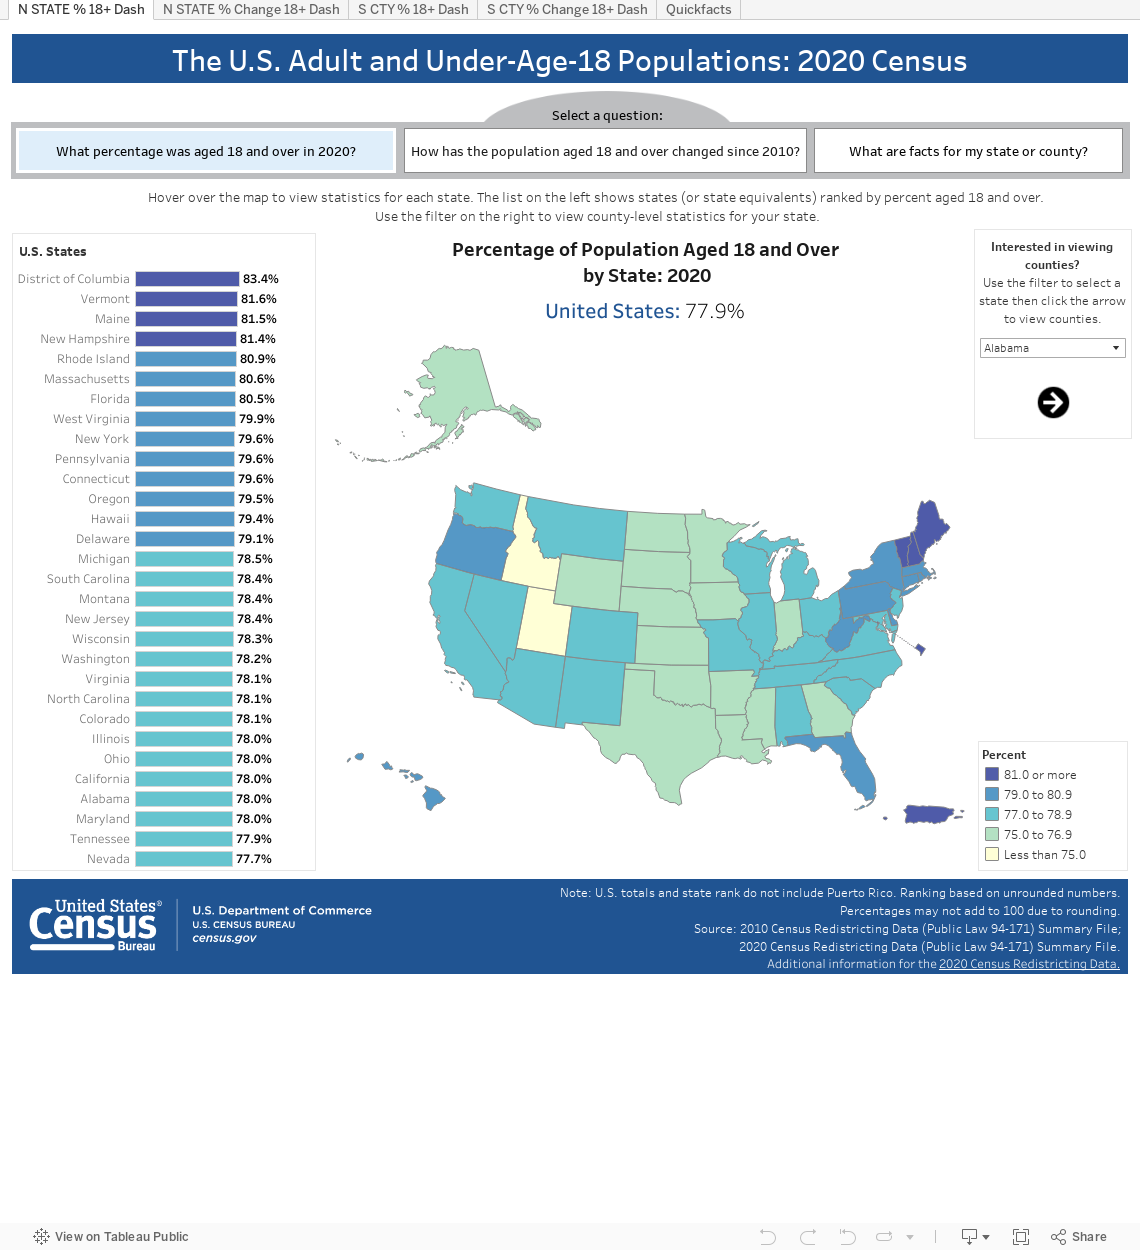
The U.S. Adult and Under-Age-18 Populations: 2020 Census
To save this data visualization as an image, click the download icon at the bottom right. To share a link to this visualization, click the share icon at the bottom right and copy the text under “Link” to your clipboard.
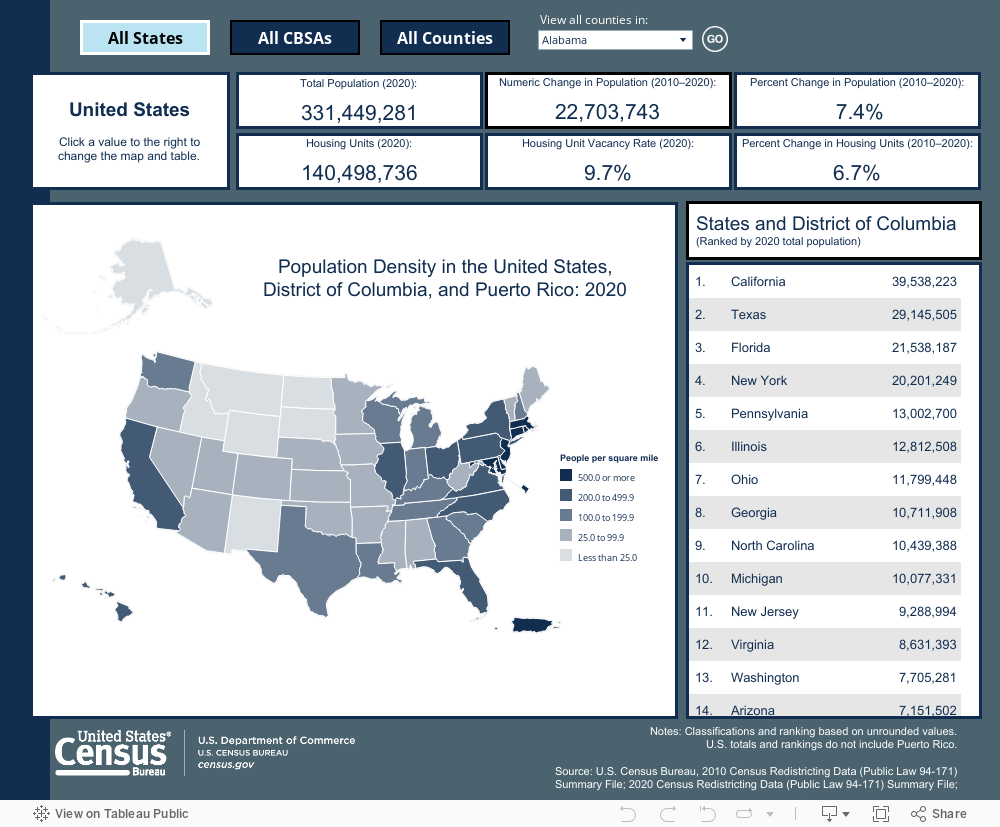
Population and Housing Change (2010-2020)
To save this data visualization as an image, click the download icon at the bottom right. To share a link to this visualization, click the share icon at the bottom right and copy the text under “Link” to your clipboard.
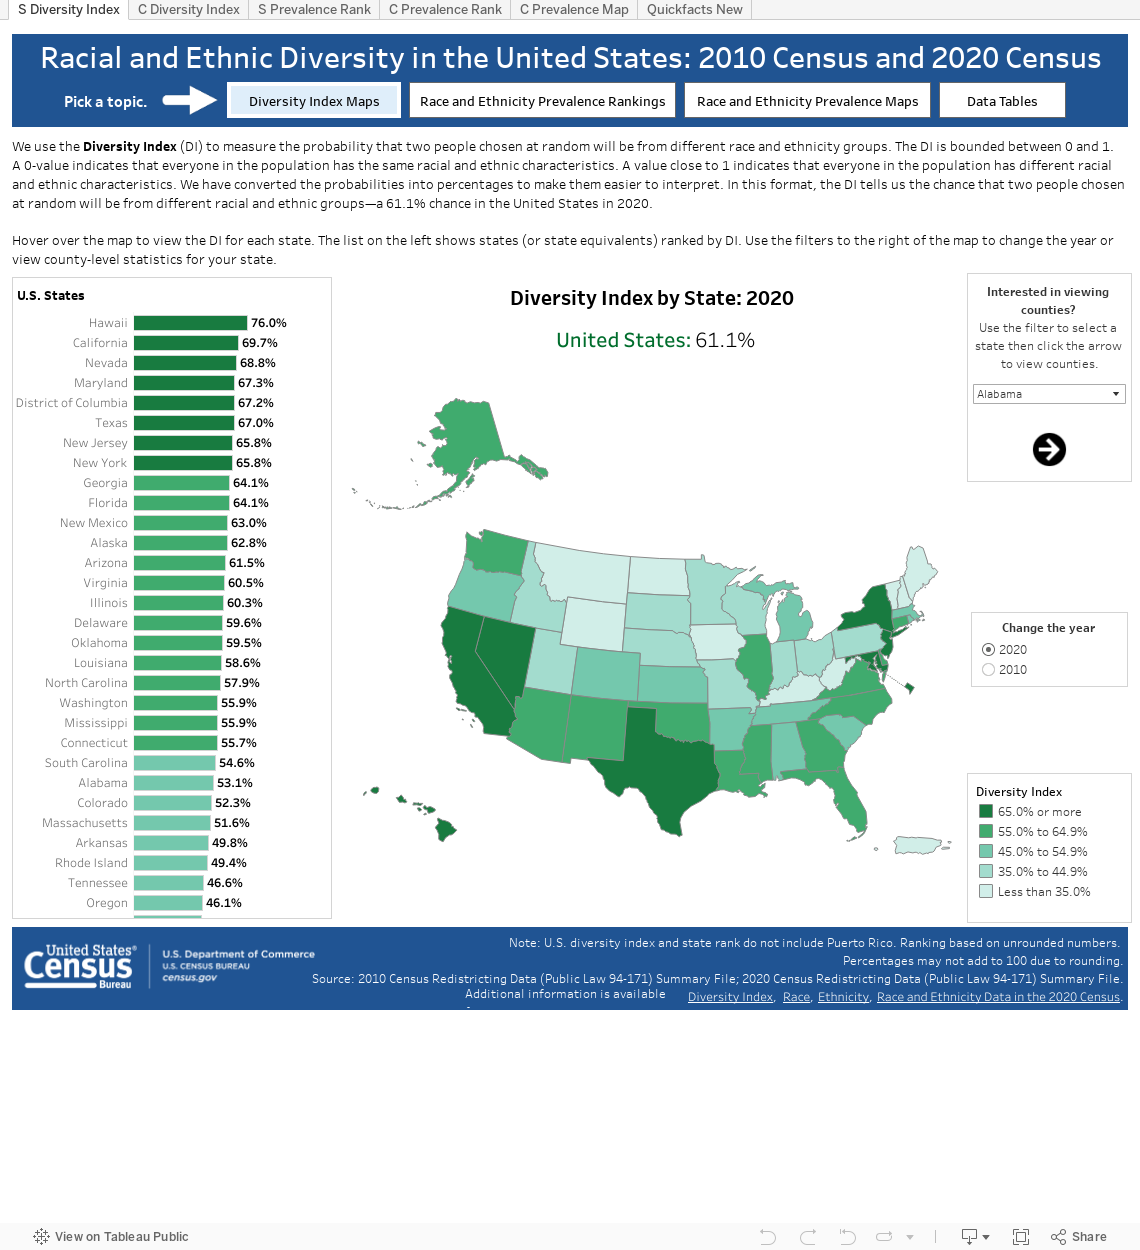
Racial and Ethnic Diversity in the U.S. (2010-2020)
To save this data visualization as an image, click the download icon at the bottom right. To share a link to this visualization, click the share icon at the bottom right and copy the text under “Link” to your clipboard.
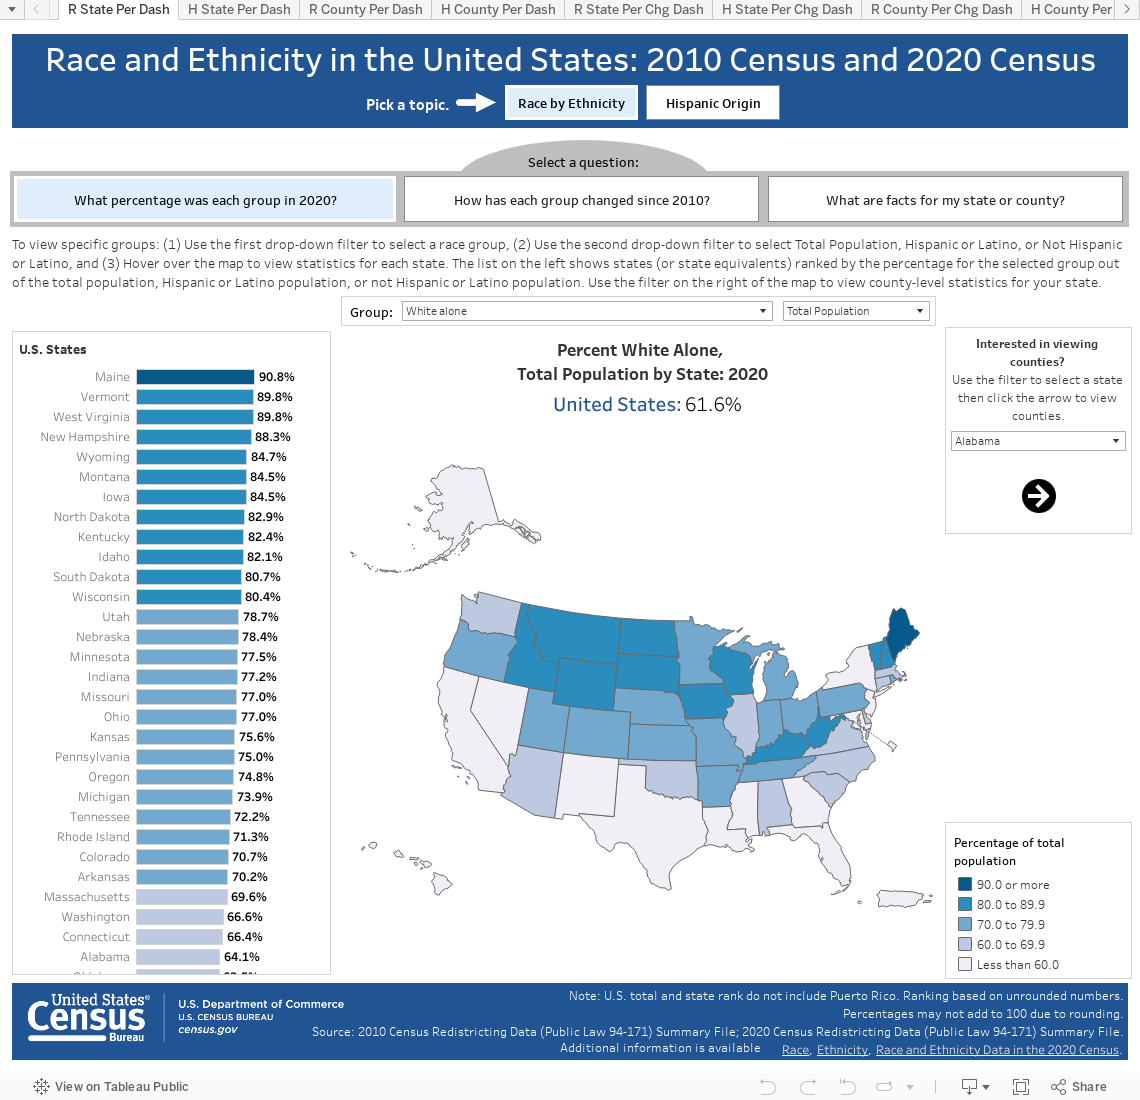
Race and Ethnicity in the U.S. (2010-2020)
To save this data visualization as an image, click the download icon at the bottom right. To share a link to this visualization, click the share icon at the bottom right and copy the text under “Link” to your clipboard.
Helpful Links for Partners and Stakeholders
We encourage you to tag the U.S. Census Bureau and/or include a link to our posts whenever possible.
Thank you for sharing 2020 Census results with your audience.
U.S. Census Bureau Official Social Media
Hashtag – #2020Census
2020 Census Redistricting Resources
Video: News Conference on Release of 2020 Census Redistricting Data
Redistricting Data Press Release
Decennial Census P.L. 94-171 Redistricting Data Summary Files
2020 Census Redistricting Files Press Kit
Data Viz: Race and Ethnicity in U.S. (2010-2020)
Data Viz: Race and Ethnic Diversity in U.S. (2010-2020)
Data Viz: The U.S. Adult and Under 18 population (2020)
Data Viz: Population and Housing Change (2010-2020)
Data Viz: Demographic Data Map
Data Gem: How to Download the Complete Set of 2020 Census Redistricting Files for Your State
Video: Accessing 2020 Census Redistricting Data from the Legacy Format Summary Files
How to Access 2020 Census Redistricting Data Files from the Census Bureau’s FTP Site
More 2020 Census Resources
Social Media Toolkit: The First 2020 Census Results
Fact Sheet: Protecting the Confidentiality of 2020 Census Redistricting Data
Fact Sheet: Comparing Differential Privacy With Older Disclosure Avoidance Methods
Data Viz: Measurement of Race and Ethnicity Across the Decades: 1790–2020
America Counts: 2020 Census Stories
Census Academy: 2020 Census Resources
Map: Apportionment of the U.S. House of Representatives
Map: 2020 Resident Population for the 50 States, the District of Columbia, and Puerto Rico
Data Quality Resources
Blog: 2020 Census Operational Quality Metrics: Item Nonresponse Rates
Blog: 2020 Census Operational Quality Metrics: Sub-State Summaries
Video: Data Quality and the 2020 Census
2020 Census Quality and Data Processing Press Release
2020 Census Quality and Data Processing Press Kit
Data Viz: 2020 Census Operational Quality Metrics
A Preliminary Analysis of U.S. and State-Level Results From the 2020 Census
Resources in Languages Other Than English
Redistricting Press Release
- Arabic
- Chinese (Simplified)
- Chinese (Traditional)
- French
- Haitian Creole
- Japanese
- Korean
- Polish
- Portuguese
- Russian
- Spanish
- Tagalog
- Vietnamese
2020 Census Redistricting Data News Conference: Spanish Resources
Kit de prensa en español (Spanish 2020 Census Press Kit)
Redistricting 101 Fact Sheet
- Arabic
- Chinese (Simplified)
- Chinese (Traditional)
- French
- Haitian Creole
- Japanese
- Korean
- Polish
- Portuguese
- Russian
- Spanish
- Tagalog
- Vietnamese
Video: What is Redistricting
Video: Data Quality and the 2020 Census